JVM-063-垃圾回收器-GC日志分析
常用参数配置
通过阅读GC日志,我们可以了解Java虚拟机内存分配与回收策略。
内存分配与垃圾回收的参数列表
-XX:+PrintGC:输出GC日志。类似:-verbose:gc-XX:+PrintGCDetails:输出GC的详细日志-XX:+PrintGCTimestamps:输出GC的时间戳(以基准时间的形式)-XX:+PrintGCDatestamps:输出GC的时间戳(以日期的形式,如2013-05-04T21: 53: 59.234 +0800)-XX:+PrintHeapAtGC:在进行GC的前后打印出堆的信息-Xloggc:…/logs/gc.log:日志文件的输出路径
-XX:+PrintGC
输出GC日志。类似:-verbose:gc
代码
1 | package com.buubiu; |
JVM参数(jdk8环境):
-Xms60m -Xmx60m -XX:+PrintGC
输出
1 | [GC (Allocation Failure) 15305K->13746K(58880K), 0.0108823 secs] |
参数解析
这个只会显示总的GC堆的变化。
- GC、Full GC: GC的类型,GC只在新生代上进行,Full GC包括永生代,新生代,老年代。
- Allocation Failure: GC发生的原因。
- 15305K->13746K:堆在GC前的大小和GC后的大小。
- 58880K:现在的堆大小。
- 0.0108823 secs: GC特续的时间。
-XX:+PrintGCDetails
代码
1 | package com.buubiu; |
JVM参数(jdk8环境):
-Xms60m -Xmx60m -XX:+PrintGC -XX:+PrintGCDetails
当-XX:+PrintGC与-XX:+PrintGCDetails都配置的时候,以能输出详细的那个参数为主,即以-XX:+PrintGCDetails为主
输出
1 | [GC (Allocation Failure) [PSYoungGen: 15298K->2528K(17920K)] 15298K->14046K(58880K), 0.0069092 secs] [Times: user=0.01 sys=0.02, real=0.01 secs] |
参数解析
- GC、Full GC: 同样是GC的类型
- Allocation Failure: GC发生的原因。
- PSYoungGen:使用了Parallel Scavenge并行垃圾收集器的新生代GC前后大小的变化
- ParOldGen:使用了Parallel Old并行垃圾收集器的老年代GC前后大小的变化
- Metaspace:元数据区GC前后大小的变化,JDK1.8中引入了元数据区以替代永久代
- xxx secs:指GC花费的时间
- Times:
- user:指的是垃圾收集器花费的所有CPU时间
- sys:花费在等待系统调用或系统事件的时间
- real:GC从开始到结束的时间,包括其他进程占用时间片的实际时间。
-XX:+PrintGCTimeStamps
代码
1 | package com.buubiu; |
JVM参数(jdk8环境):
-Xms60m -Xmx60m -XX:+PrintGC -XX:+PrintGCTimeStamps
输出
1 | 0.118: [GC (Allocation Failure) 15360K->13990K(58880K), 0.0068465 secs] |
参数解析
- 0.118 0.126:在每行的前面加上了虚拟机启动到现在执行的秒数
-XX:+PrintGCDateStamps
代码
1 | package com.buubiu; |
JVM参数(jdk8环境):
-Xms60m -Xmx60m -XX:+PrintGC -XX:+PrintGCDateStamps
输出
1 | 2024-01-22T13:08:39.040+0800: [GC (Allocation Failure) 15298K->14006K(58880K), 0.0077802 secs] |
参数解析
- 2024-01-22T13:08:39.040+0800:在每行的前面加上了年月日时分秒时间
-Xloggc
如果想把GC日志存到文件的话,是下面这个参数:
-Xloggc:/path/to/gc.log
补充说明
jvm参数:
-Xms60m -Xmx60m -XX:+PrintGCDetails
输出:
1 | [GC (Allocation Failure) [PSYoungGen: 15298K->2528K(17920K)] 15298K->14046K(58880K), 0.0188531 secs] [Times: user=0.01 sys=0.02, real=0.02 secs] |
[GC和[Full GC说明了这次垃圾收集器的类型,如果有”Full”则说明GC发生了”Stop The World”如果使用Serial收集器在新生代的名字是Default New Generation,显示的是”[DefNew”
如果使用Serial Old 收集器在新生代的名字是Default Old Generation,显示的是”[DefOld”
如果使用Parallel scavenge收集器在新生代的名字是”[PSYoungGen”
老年代的收集和新生代道理一样,名字也是收集器决定的
如果使用ParNew收集器在老生代的名字会变成”[ParNew”,意思是”Parallel New Generation”
如果使用Parallel Old 收集器在老生代的名字是”[PSOldGen”
如果使用G1收集器的话,会显示为”garbage-first heap”
Allocation Failure表明本次引起GC的原因是因为在年轻代中没有足够的空间能够存储新的数据了。
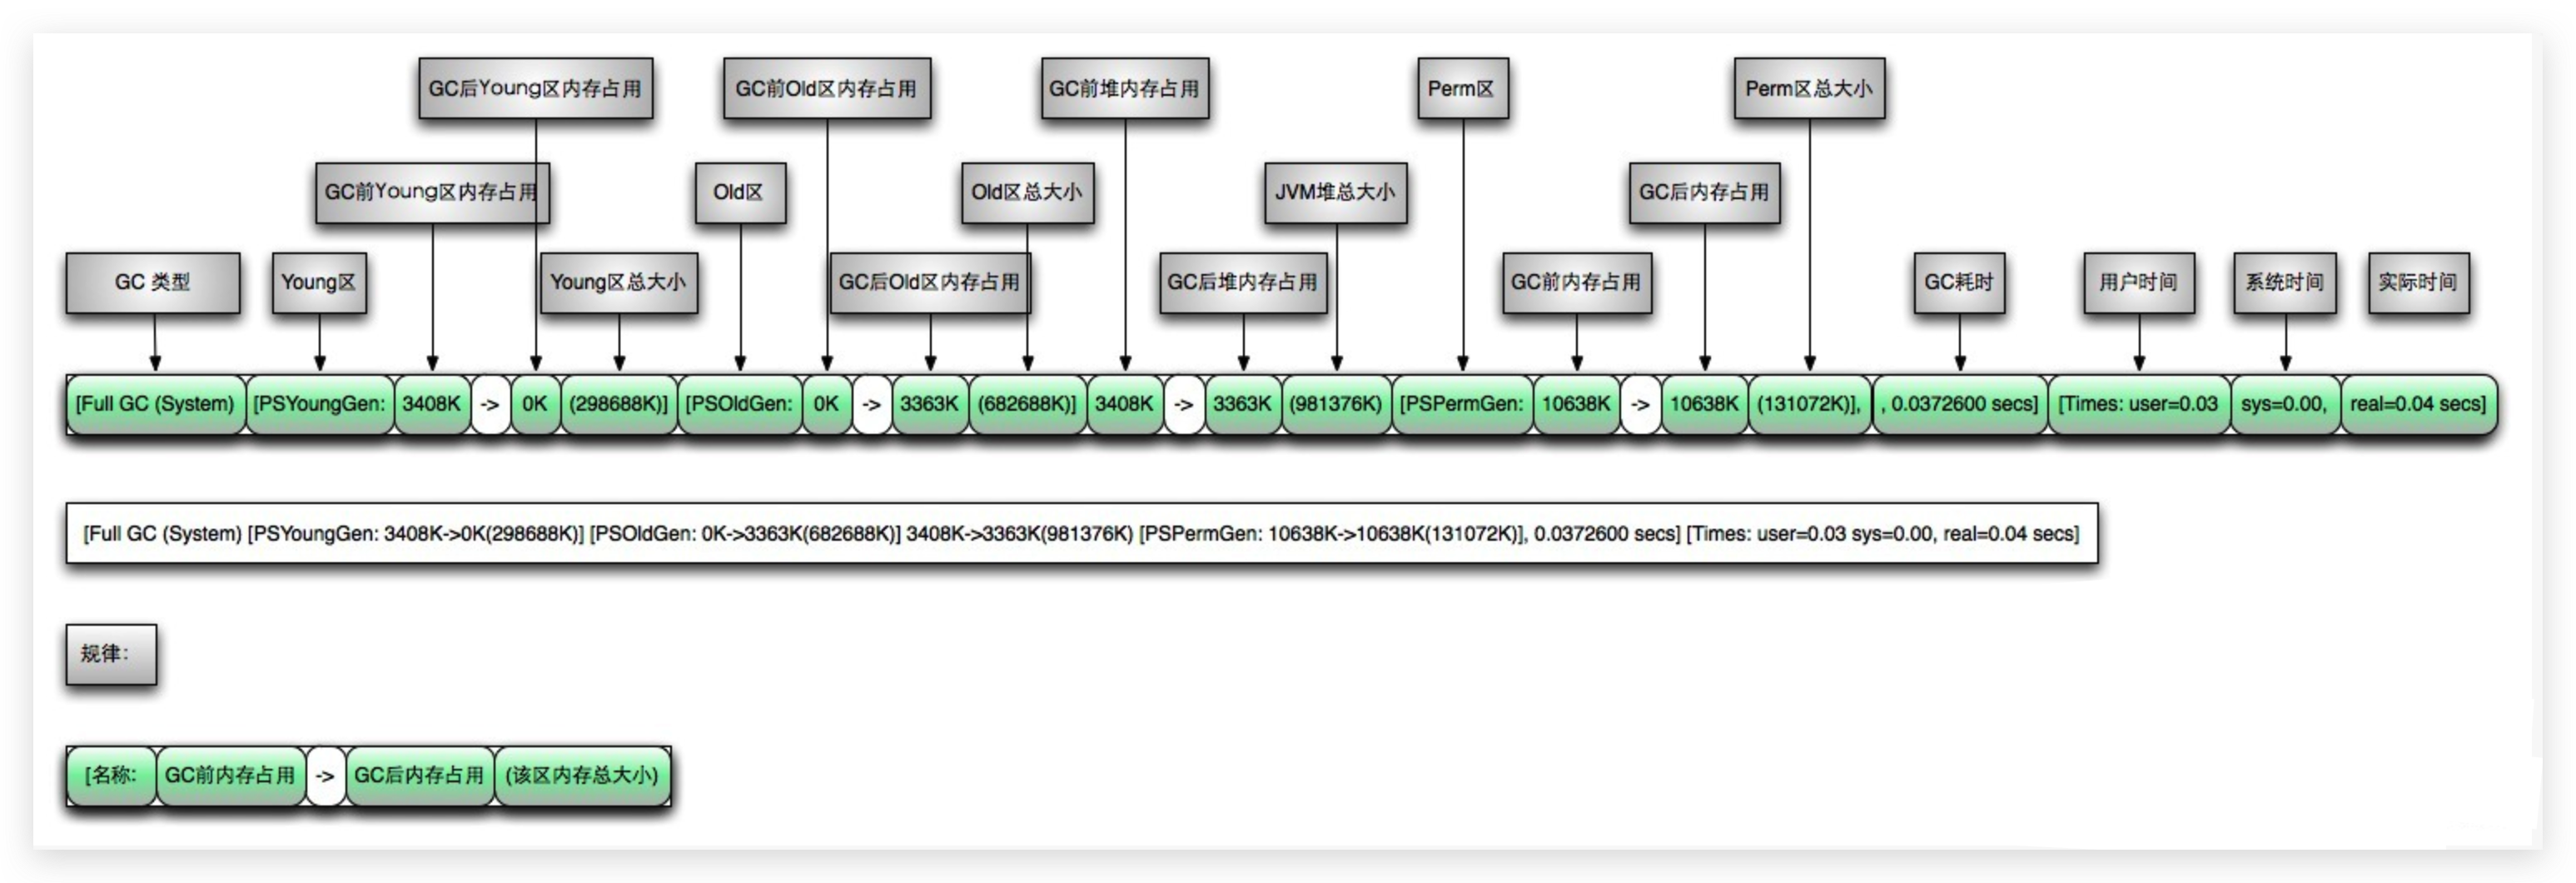
[PSYoungGen: 15298K->2528K(17920K)] 15298K->14046K(58880K)- 中括号内:GC回收前年轻代大小 -> 回收后大小(年轻代总大小)
- 中括号外:GC回收前年轻代和老年代大小 -> 回收后大小(年轻代和老年代总大小)
user代表用户态回收耗时,sys内核态回收耗时,real实际耗时。由于多核线程切换的原因,时间总和可能会超过real时间
文字解释
1 | Heap(堆) |
图示解释

举例
1 | package com.buubiu; |
JDK7 中的情况
1 | [GC (Allocation Failure) [DefNew: 7893K->347K(9216K), 0.0062353 secs] 7893K->6491K(19456K), 0.0062611 secs] [Times: user=0.00 sys=0.00, real=0.00 secs] |
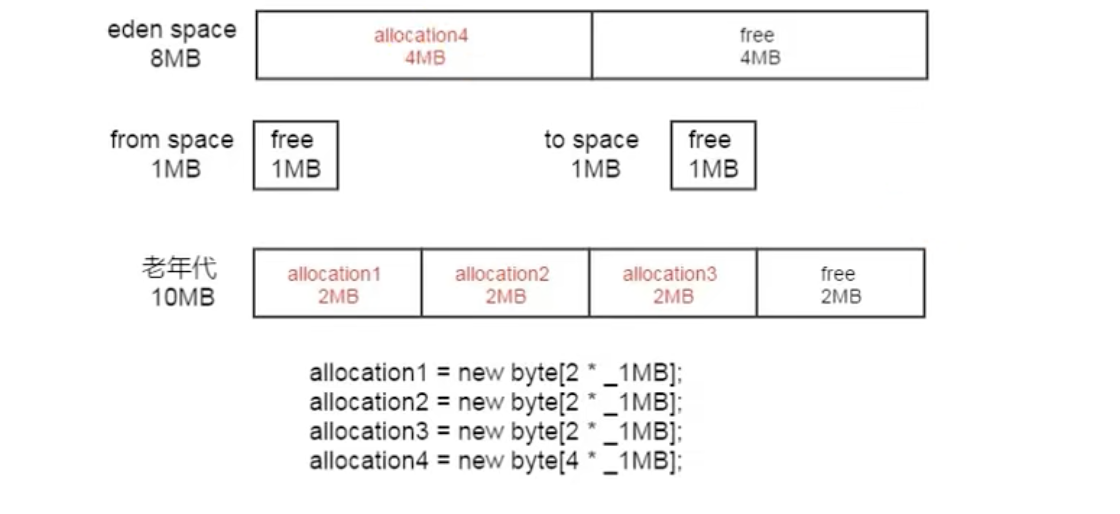
- 首先会将3个2M的数组存放到Eden区,然后后面4M的数组来了后,将无法存储,因为Eden区只剩下2M的剩余空间了,那么将会进行一次Young GC操作,将原来Eden区的内容,存放到Survivor区,但是Survivor区也存放不下,那么就会直接晋级存入Old 区
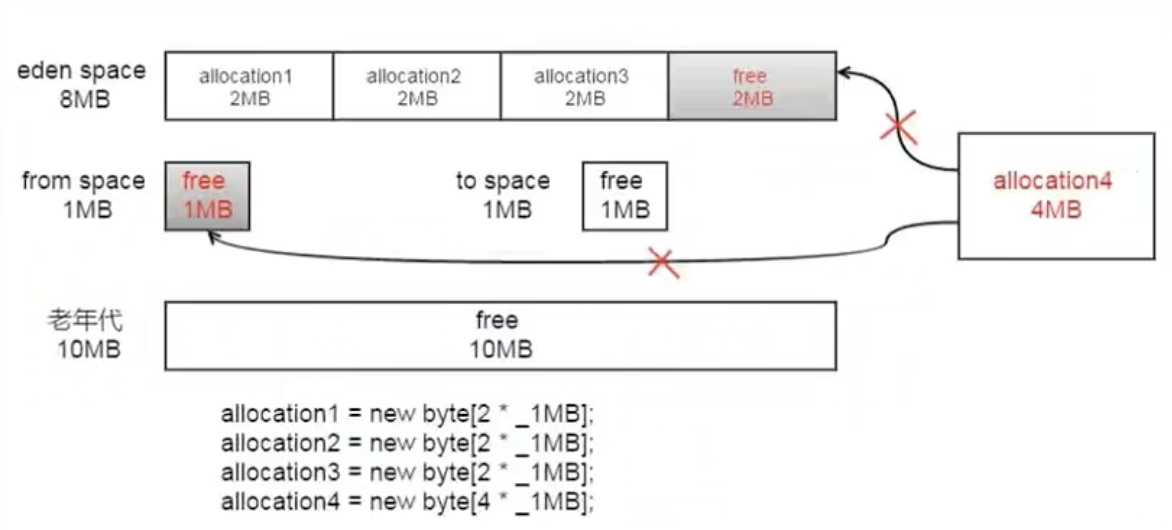
- 然后将3个2M的数组存入到Eden区中
JDK8 中的情况
1 | [GC (Allocation Failure) [DefNew: 6322K->668K(9216K), 0.0034812 secs] 6322K->4764K(19456K), 0.0035169 secs] [Times: user=0.00 sys=0.00, real=0.00 secs] |
与 JDK7 不同的是,JDK8 直接判定 4M 的数组为大对象,直接怼到老年区去了。
部分jdk8版本还是像7一样,不会把4M直接放到老年代,可以用参数:-XX:PretenureSizeThreshold=4M 调整对象直接进入老年代的阈值参数,默认0
日志分析工具
根据保存的日志文件来分析。
可以用一些工具去分析这些GC日志,常用的日志分析工具有:
GCViewer、GCEasy(推荐)、GCHisto、GCLogViewer、Hpjmeter、garbagecat等
JVM-063-垃圾回收器-GC日志分析